
Exposure Atlas
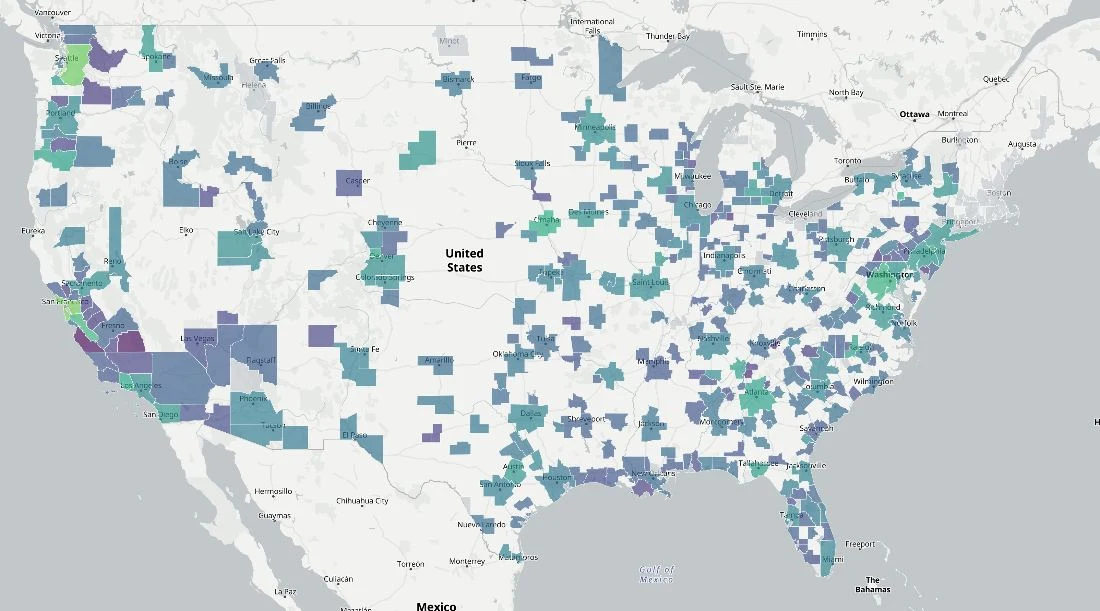
A weekly map of AI and automation exposure across US metro areas, UK regions, and EU NUTS2 regions, with confidence and source context attached to every score.
What it helps with
National averages hide how differently AI and automation may affect local labour markets. Exposure Atlas makes those regional differences explorable while showing where the evidence is detailed, where it is coarse, and where a comparison would be misleading.
What was built
The project combines occupational exposure, layoff momentum, and worker sentiment in a weekly map for US metro areas, UK regions, and EU NUTS2 regions. Every score includes its components, sample sizes, and a high, medium, or low confidence rating. The European data uses broader occupation groups, so it is normalised separately, capped at medium confidence, and never presented as directly comparable with the US.
What made it different
The careful part is the behaviour when evidence is weak. If a weekly source fails, the map keeps the last valid data, marks it as stale, and shows a freshness warning. Invalid or empty data is not published. That makes the atlas useful for exploring exposure without presenting a composite score as a forecast.
A map can make uncertain evidence look definitive. Confidence, sample size, freshness, and regional limits need to be visible beside the score.
What it demonstrates
- US, UK, and EU regional exposure maps
- Structural exposure, layoff momentum, and worker sentiment
- Confidence, sample size, freshness, and methodology beside every score
Need something similar, customised for you? Get in touch.