
Bencium Nearby
A quiet counter for shops, retail floors and event spaces. It listens for the phones, earbuds and smartwatches people carry, and turns them into a simple picture of how busy you are right now, what a normal day looks like, and when something unusual is happening.
BenciumNearby: knowing how busy your space really is
| For | Shop owners, retail managers, venue and event organisers |
| Runs on | Mac, iPhone and iPad. Download for Mac (version 0.1, 3.9 MB) |
| Built | September 2026 |
| Extra hardware needed | None. The Mac, iPhone or iPad you already own does the listening. |
| Where the data lives | On that device only. No cloud, no account, no monthly fee. |
The problem
Every shop owner can tell you their busy hours. Ask them to prove it and most can't.
The till shows who bought something. It doesn't show the people who walked in, looked around and left, the queue that formed at 12:40, or the Saturday that was twice as busy as usual because of an event down the street. Door counters and camera systems can measure this, but they cost money to install, often come with a subscription, and cameras bring privacy questions that a small business doesn't want to deal with.
The question we started from was simple: can a device you already own tell you how busy your space is, without cameras, without new hardware, and without collecting anything personal?
The idea
Almost everyone walking through a door carries something that sends out a small Bluetooth signal every second or so: a phone, wireless earbuds, a smartwatch, a fitness band. These signals are public by design; it's how your earbuds find your phone.
BenciumNearby listens for them. It doesn't connect to anything, doesn't send anything out, and doesn't need to know who anyone is. It simply counts how many devices are around, minute by minute, and learns what "normal" looks like for your space.
Leave it running on a Mac behind the counter or an iPad on the wall, and over a few days it builds up a picture of your trading pattern.
What it shows you
Right now
One line at the top always tells you the essentials, for example:
38 around · usual 30 at 9 (weekdays)
So at a glance you know how busy you are, and whether that's more or less than usual for this hour.
There's also a live list of every device being picked up, with how strong its signal is and a plain guess at what it is (a phone, earbuds, a TV, a printer).
Today, hour by hour
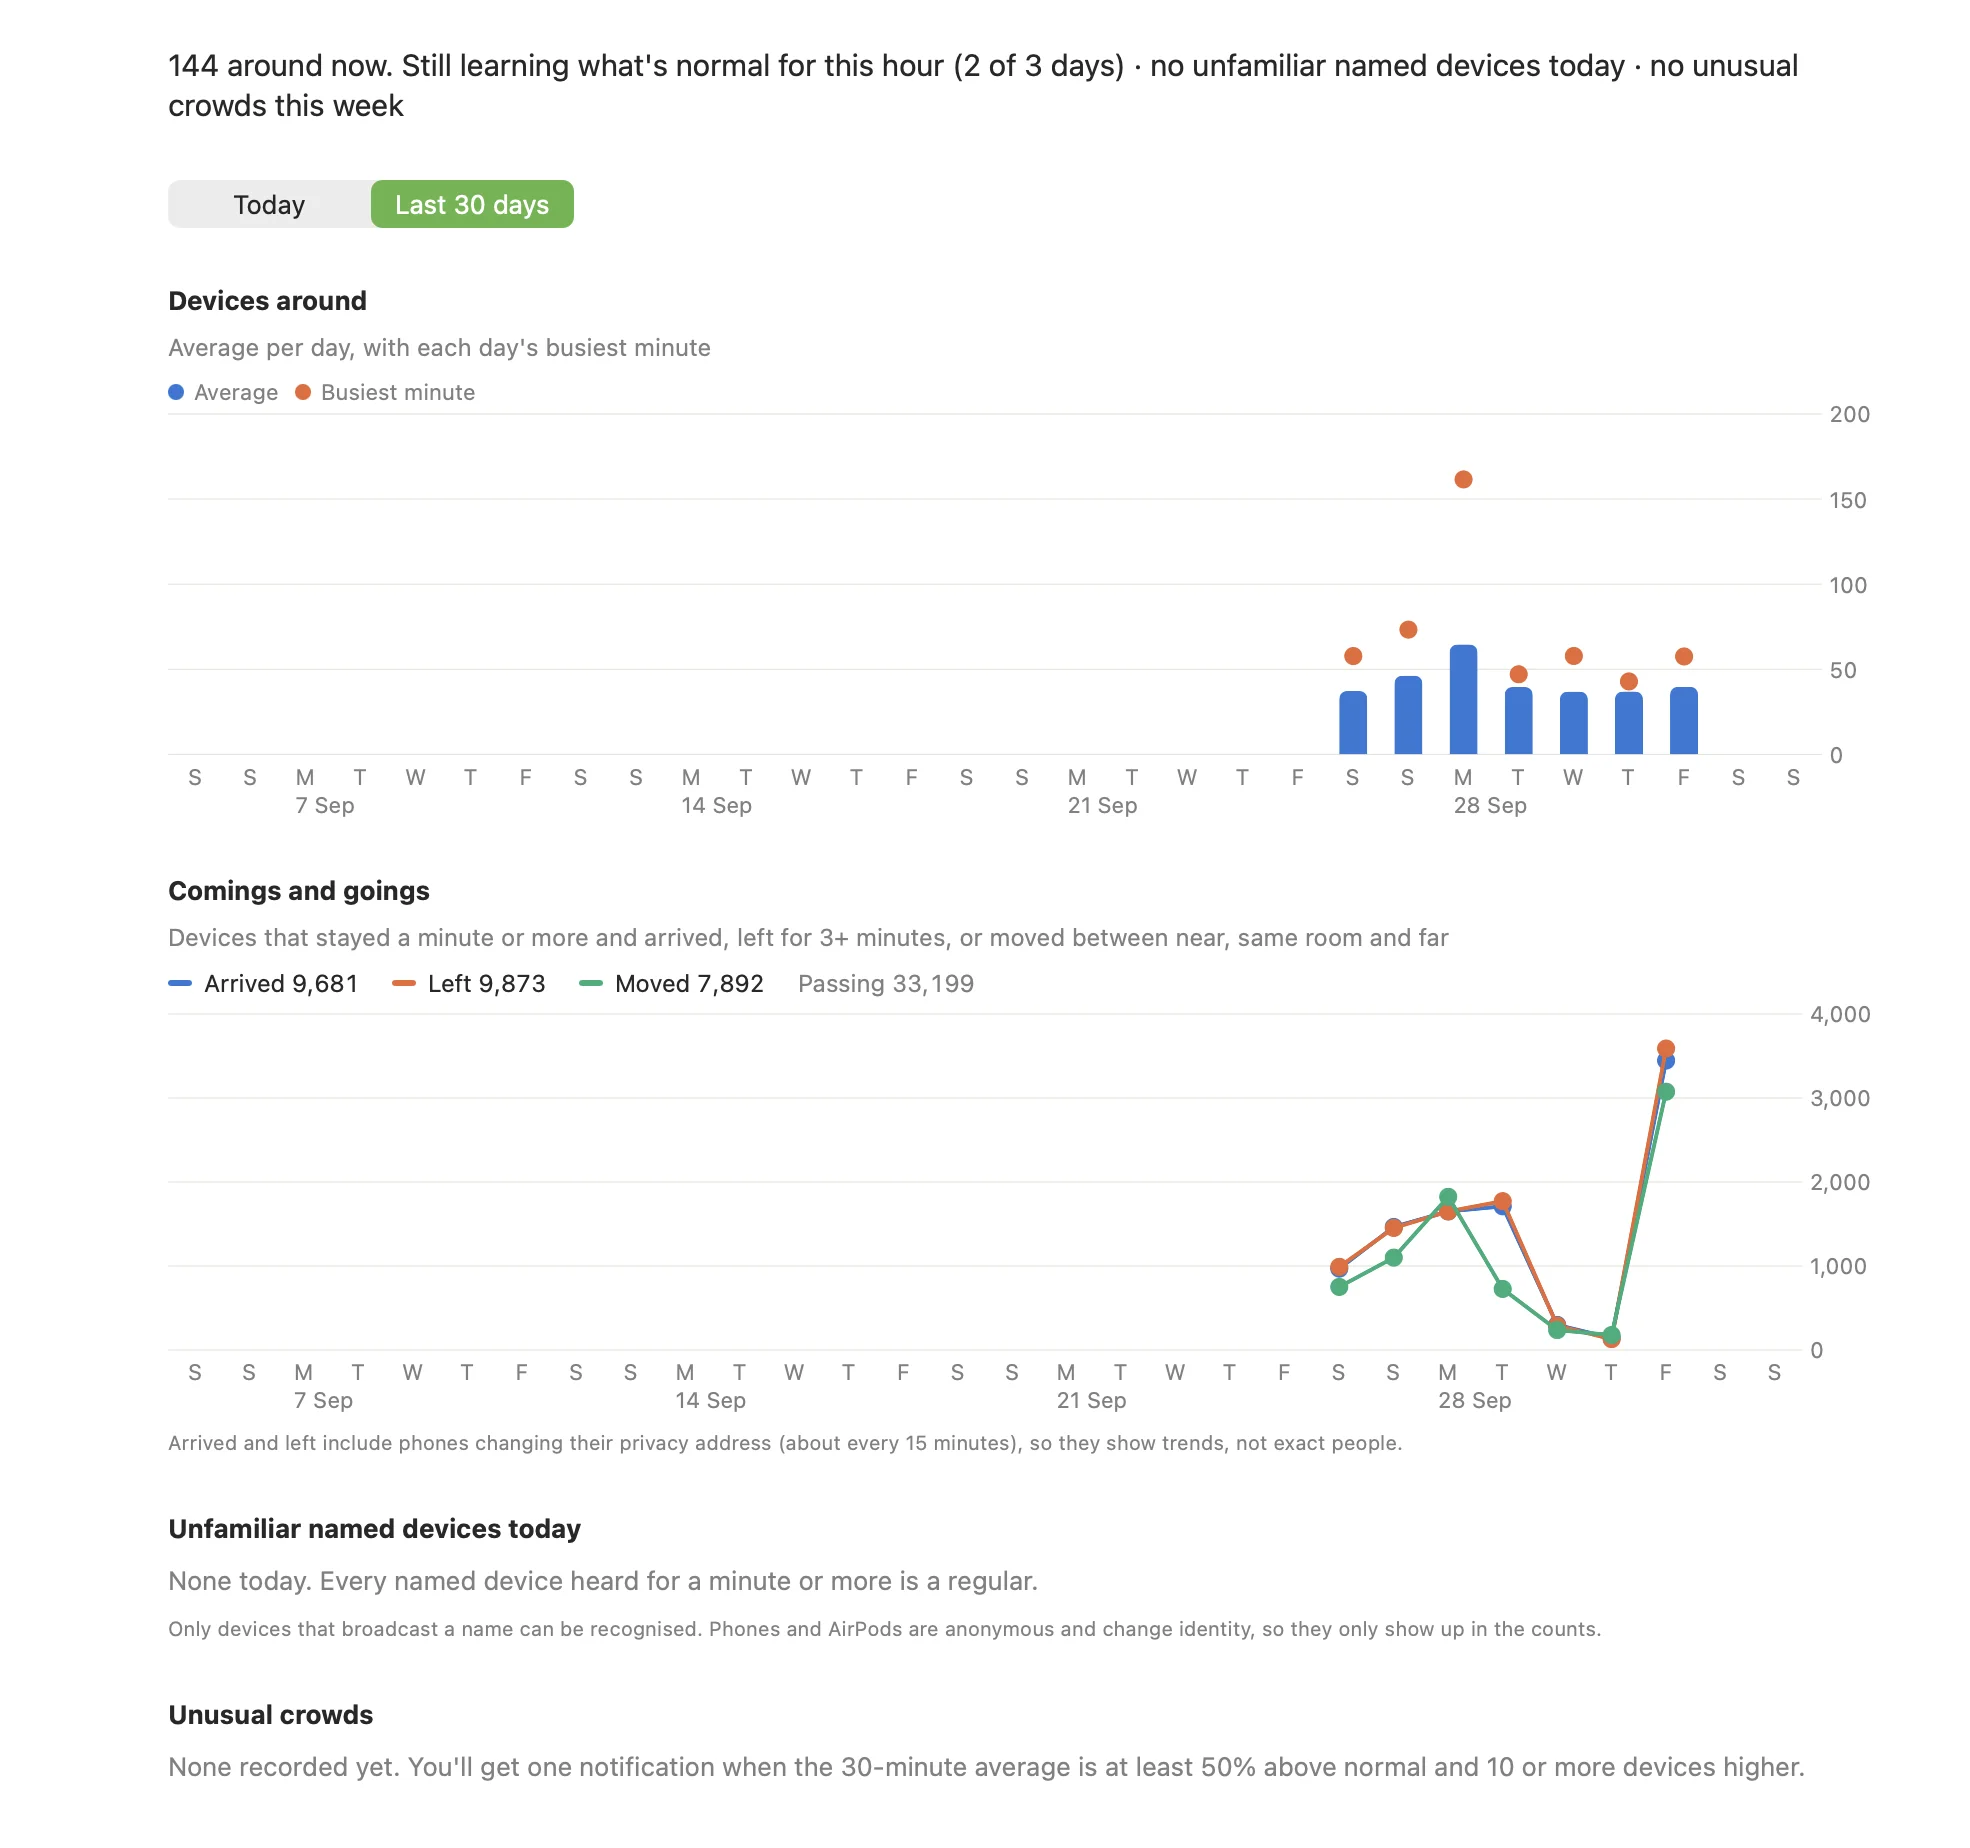
A chart of how many devices were around at each hour of the day, drawn against the usual level for that hour. It also shows how many people:
- arrived (stayed a minute or more)
- left
- were just passing (picked up for less than a minute: window shoppers, people walking past the door)
That last one matters. The gap between "passing" and "arrived" is a rough measure of how well the shop front turns passers-by into visitors.
The last 30 days, day by day
The same chart, one bar per day. Weekly rhythms jump out straight away: the quiet Tuesday, the Friday afternoon rush, the Saturday that dwarfs everything else.
Unusual crowds
When the space gets noticeably busier than normal, the app sends one notification. Not every time a few extra people walk in, and it won't keep pinging while the crowd hangs around.
Every surge is logged with its time and size, so at the end of the week you can see when the crowds came: a lunchtime promotion that worked, a queue that needed a second till, a show that drew more people than expected.
Seasons
"Normal" is always based on the last 4 weeks, so it moves with the seasons by itself. As December trade builds, the usual level rises with it, and a surge means busier than this time of year, not busier than a quiet February. The app keeps 90 days of history, enough to look back across a whole season.
Privacy, built in from the start
For a business, counting customers must never become tracking customers. That rule shaped every decision.
- No cameras, no faces, no names of people. The app only hears Bluetooth signals.
- Anonymous devices are only ever counted. Phones, earbuds and watches are never recorded individually. The saved history is one line per minute: how many were around, arrived, left or passed. Nothing else.
- Phones protect their owners anyway. Modern phones change their Bluetooth identity about every 15 minutes. The app works with this rather than around it: it never tries to follow one person over time.
- Nothing leaves the device. No cloud, no account, no internet connection used at all. On iPhone and iPad, the history is even kept out of iCloud backups.
- It never connects to anyone's device and never broadcasts anything of its own.
- History deletes itself after 90 days.
Designed to be read at a glance
The charts were built for people who don't want to study charts:
- Colours were checked to stay distinct for colour-blind viewers, and in both light and dark mode.
- Totals are printed as text too, so nothing depends on colour alone.
- The list of devices doesn't jump around. Rows stay where they first appeared and fade when a device goes quiet, instead of vanishing and shuffling everything below.
There are also three alternative visual styles, born from a typography exploration, that turn the live view into something closer to a display piece: one where each device's name grows and shrinks with its signal, one that hangs big signal numbers from a single line, and one that gently fades devices as they leave. On a screen in a venue foyer, the room's activity becomes something to look at.
What's next
Ideas for taking it further, not yet built:
- Year-on-year comparison, so this December can be compared with last December.
- Several locations in one view, for a business with more than one shop or a venue with several rooms.
- Filtering out the street, so passing pavement traffic doesn't count as visitors.
- Exporting the daily and monthly numbers to a spreadsheet for planning staff rotas.
In short
BenciumNearby turns a device you already own into a quiet, private footfall counter. It tells you how busy you are right now, how that compares with a normal day, how your week and month are shaping up, and when something out of the ordinary is happening, all without cameras, subscriptions or collecting anything personal about your customers.
Need something similar, customised for you? Get in touch.